3D animation is one of the core reasons why someone would look at learning an application like Blender 3D, as it can be used to create both 2D and 3D animations to almost any scale and level of detail. The graph editor is a tool used in Blender to take those animations to the next level.
The graph editor focuses on controlling the relationship between two adjacent keyframes by using points on a graph to change how our object behaves in between these keyframes, changing how each corresponding frame responds to the next one and adding more control to how the animation looks in the viewport.
When creating 3D animations in Blender, the graph editor may not always be required, but it can often be the difference in quality when it comes to the final result when used.
What Is The Purpose Of The Graph Editor?
Several editor types in Blender focus on creating animations, with some editors being more critical than others, but all having a specific purpose. Three editor types, in particular, are crucial to making any 3D animation.
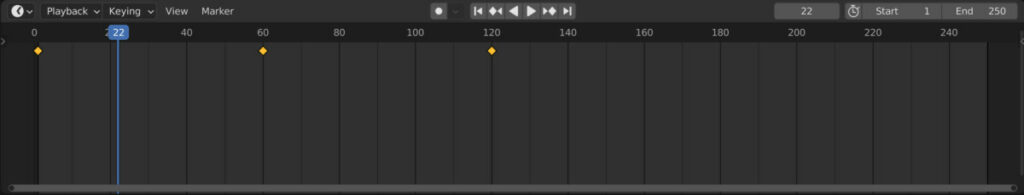
The timeline is the first point of call for animation; it allows you to view the positioning of any keyframes that you have added to your selected objects and use the playback controls to preview your animation within the viewport before you render.
This is the single most crucial editor to use because you should always have access to controls that allow you to preview your creation.
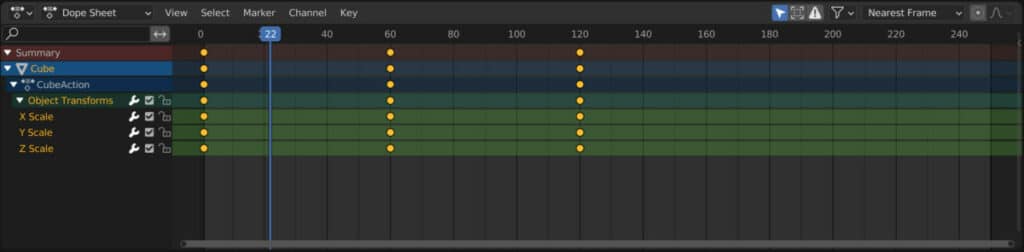
On the other hand, the dope sheet is helpful for the positioning and control of the various keyframers that we create. It allows us to edit individual channels and organize our keyframe hierarchy.
It has additional options like the channel and key menus that give us further control of the structure of our animation.
Then we have the graph editor, a very different visual display of how our keyframes connect. Within the graph editor, we can control the handles of our keyframes, which is the primary way we can influence their behavior.
Think of it this way, the timeline allows us to edit the animation as a whole, the dope sheet allows us to edit the keyframes we create, and the graph editor changes what happens between them.
For example, we can use the graph editor so that a change in rotation speeds up as we get closer to the next keyframe, or we could have an object overshoot its target location and then have it come back.
How To Access In The Graph Editor?
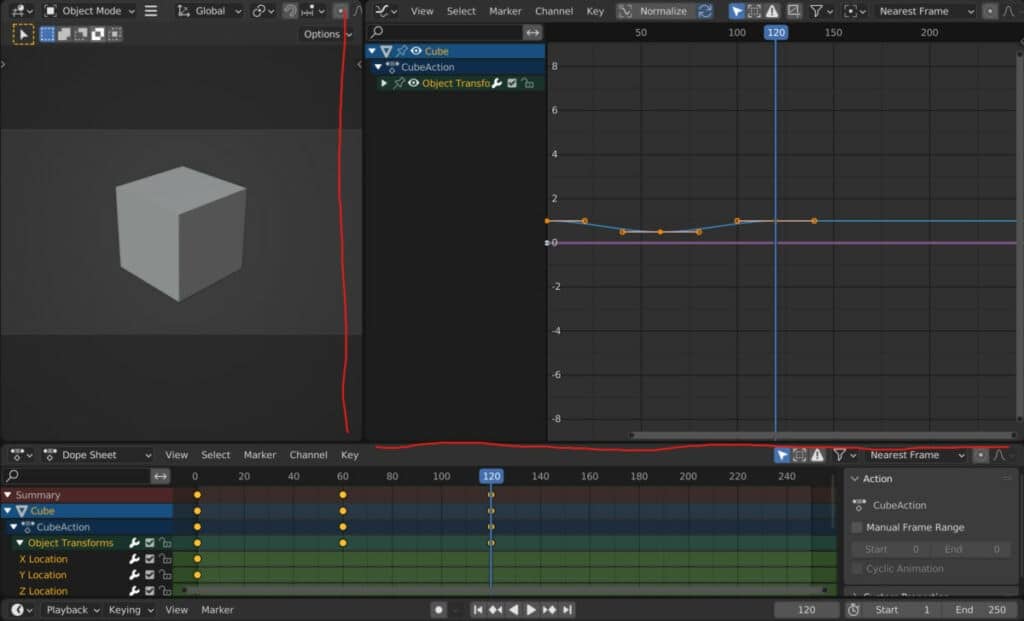
The graph editor is an additional resource for animators that is not immediately available in any existing workspaces.
Even in the animation workspace, the graph editor is not yet visible, and instead, we have the outliner, properties, two 3D viewports, the timeline, and the dope sheet made available.
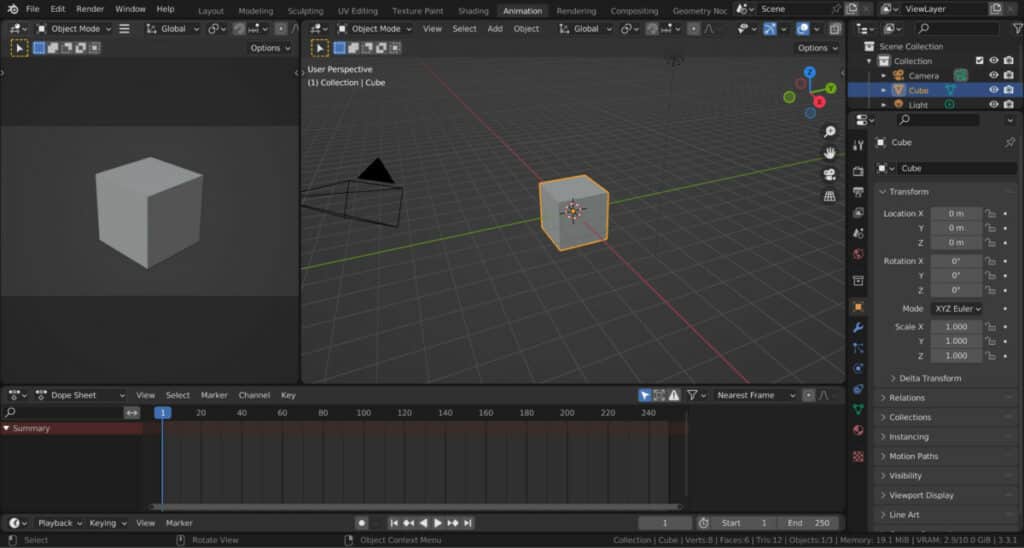
This is more to do with the fact that there is not enough space to add the extra editor type to our workspace.
The Graph Editor requires significant space to use both horizontally and vertically, so if we wish to use it the best thing to do is replace one of the two 3D viewports.
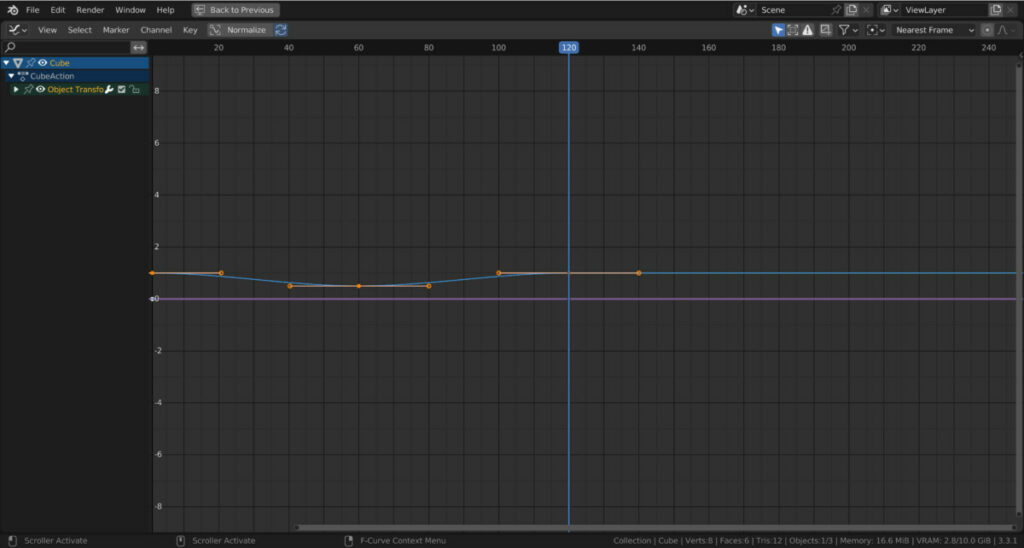
The editor can be accessed like any other; go to the editor type menu and locate the graph editor in the animation category.
If you still require more room in the UI to use the editor, you can use the toggle maximize area option found in the view menu under area, or use the hotkey Control + Spacebar.
How To Read Your Graph Editor?
Both the timeline and the dough sheets are straightforward to read. They represent the frames and the keyframes that are positioned on them.
For example, the numbers assigned to our timeline represent either the frames or the seconds of our animation. We only need to read our timeline or dope sheet from left to right.
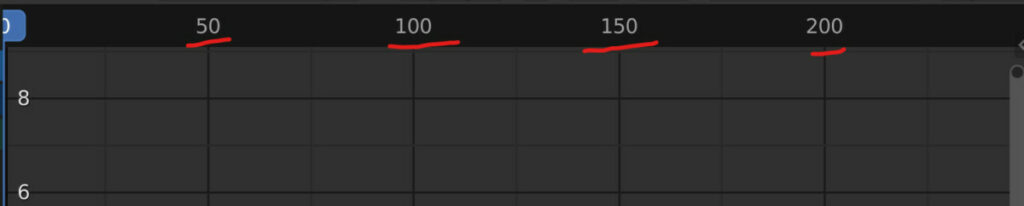
The graph editor, on the other hand, requires us to read vertically and horizontally. Like the timeline, the horizontal numbers we see in the graph editor represent the animation itself in terms of the number of frames or seconds.
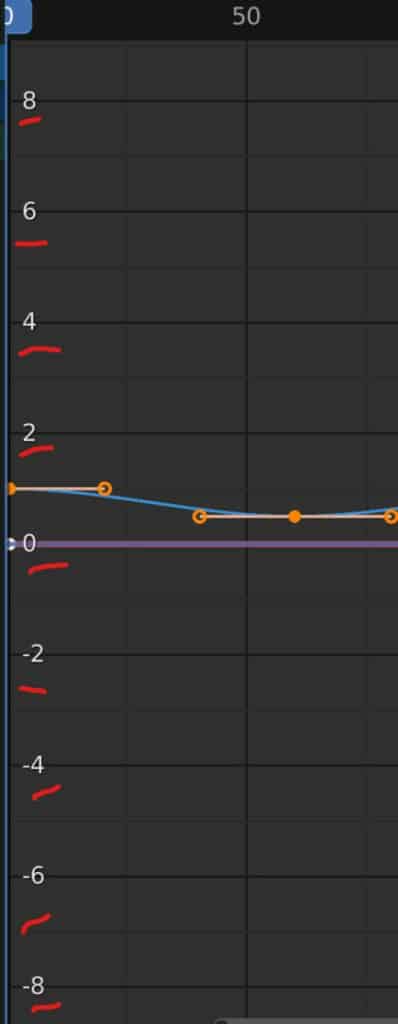
The vertical numbers represent the values assigned to the keyframes visible within the graph editor.
We can use the scroll wheel to zoom in and out of our editor and its keyframes to see more of our growth editor. We can also move around the graph editor using the middle mouse button, similar to how we orbit in the viewport.
Controlling Handles In The Graph Editor
One of the easiest ways to use the graph editor to change our animation behaviors is to manipulate the handles of our keyframes.
In this editor, the diamond-shaped dots have been replaced with more circular points, each with a pair of handles on either side.
These handles are used to define to transition to a keyframe or directly after one. By default, they are linked, so the right handle is also affected when you move the left handle.
So what can we do when moving these handles? One example is to overshoot a value before it reaches a keyframe and then reverts to that value.
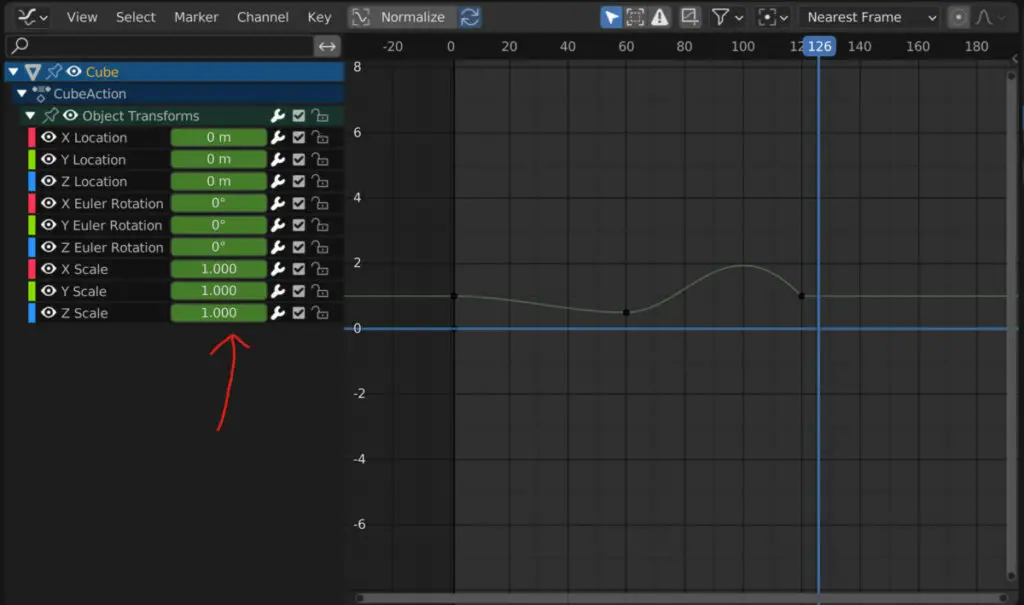
Let’s take the scale of the cube, where we add three keyframes in total. The first keyframe is the start point, the second is the cube scaled down, and the third is the end point where the object is scaled back up.
By default, when we reach that third keyframe, the animation will scale up to that final value, but we can use the handles to scale beyond it.
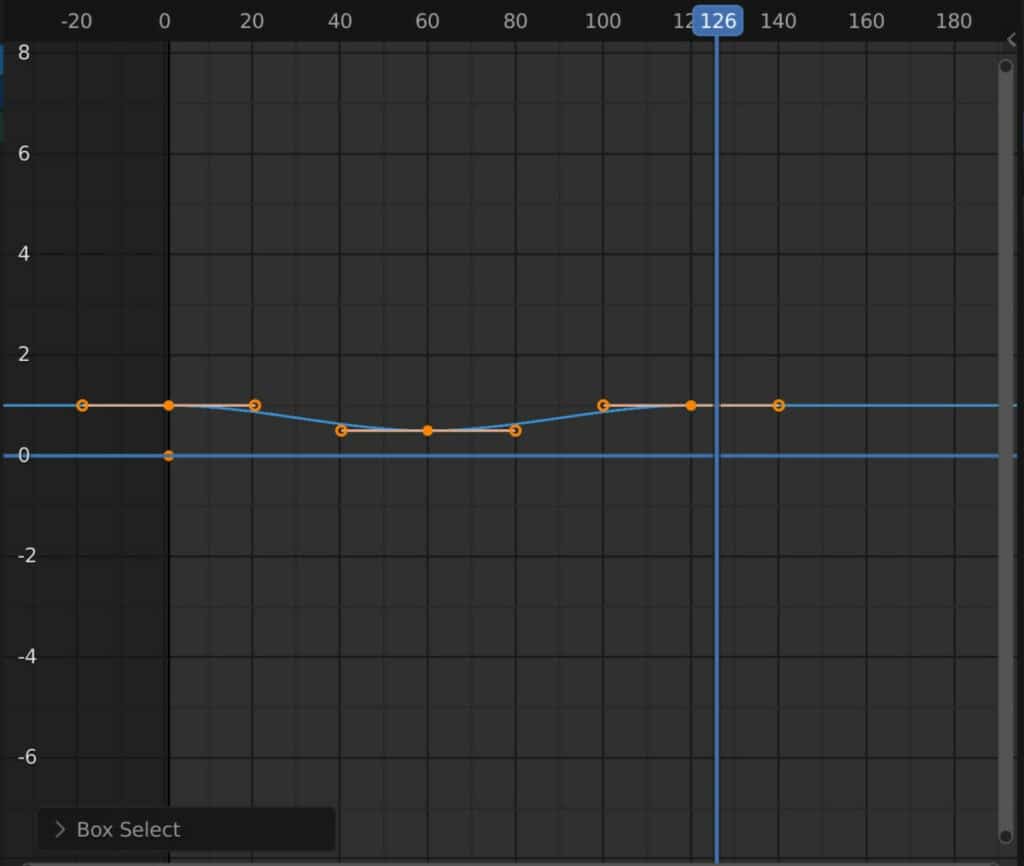
That handle will likely represent three channels, one for each axis. Use box select to select all the handles at that point, then select the left handle and drag it up.
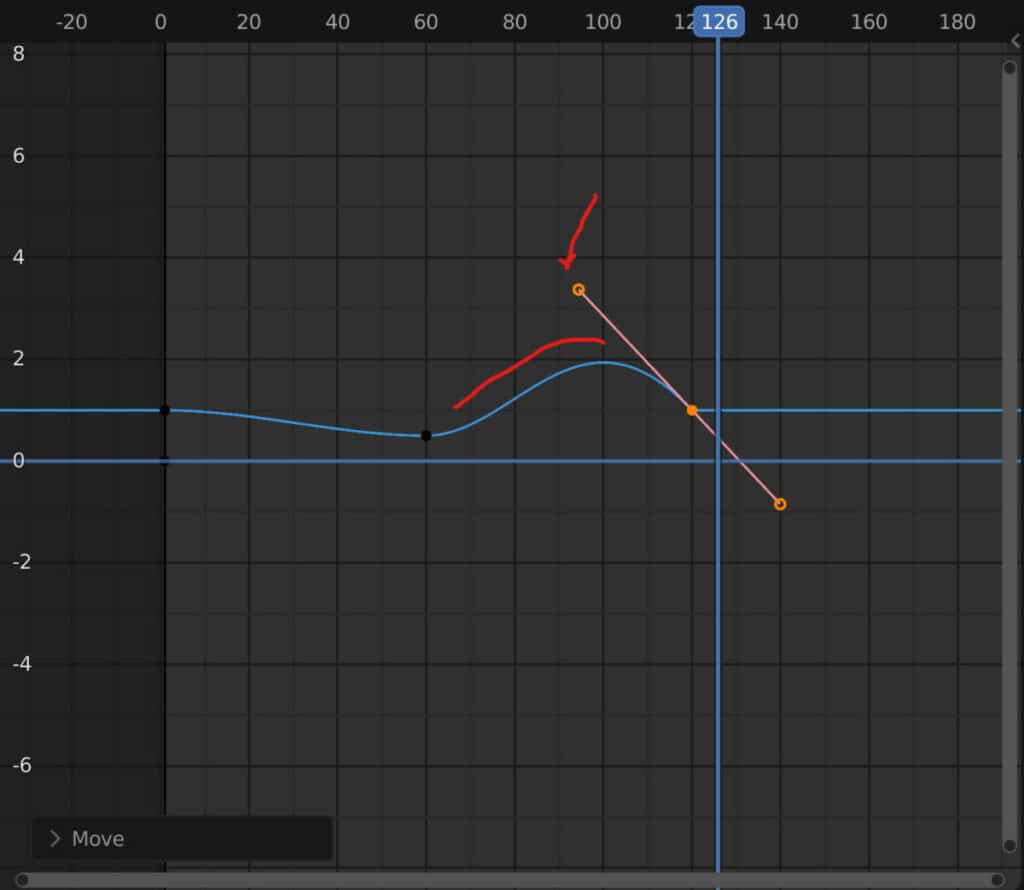
You will see that the line that connects the 2nd and 3rd keyframes changes its shape, and a hill forms just before the third keyframe.
Playback your animation from the start using the playback controls in the timeline, and as you reach that third keyframe, the object will scale beyond the value of that frame before scaling back down to that value. In other words, the object will appear to bloat.
Another way of putting it is that the scale value of the third keyframe is set to two, but by pushing the handle up, the scale value hits a high of 2.4 before scaling back down to two.
Can You Add Keyframes In The Graph Editor?
The timeline and dope sheets are better used to view the keyframes you create in Blender. However, we are still able to view and select the keyframes within the graph editor, just in a different way.
Additionally, we can add new keyframes if we wish. The easiest way to add a keyframe is to select the frame within the graph editor to that you want two add a keyframe to.
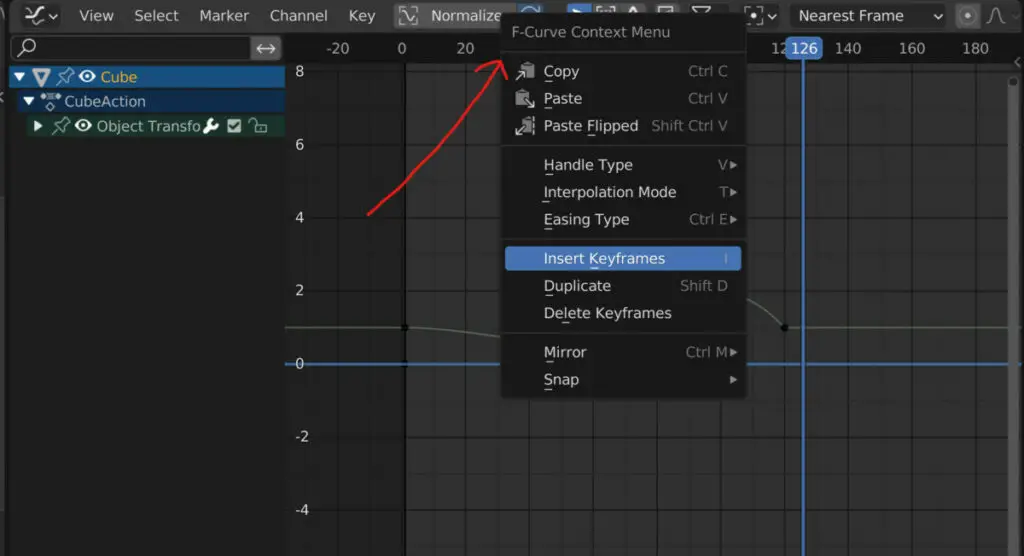
Then bring up the graph editor’s context menu using the right mouse button. Towards the bottom of the context menu, you can insert a keyframe.
That keyframe will be added to whichever channel you have selected. So if you wish to add the keyframe to multiple channels, ensure they are all selected.
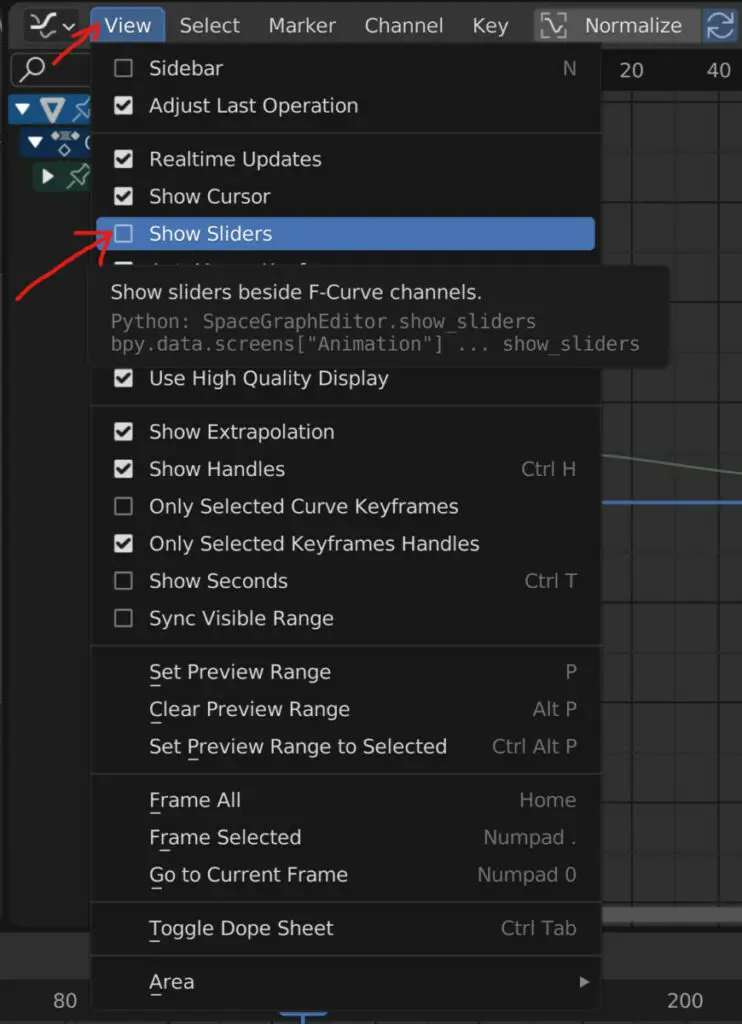
Alternatively, you can go to the view menu, where you can toggle the display of various elements within the graph editor. One such element is the slider value for individual channels. Turn this on, and then you can manipulate the values on the individual channels for whichever frame you are currently on.
Manipulating these values will automatically add new keyframes at the current location. This is one of those tools where it is better to view the graph editor as the full display of your UI to see better what you’re doing, as specific tools within the graph editor can overlap when viewed.
How To Better View Rotation Values?
While reading the location and scale values in the graph editor is easy enough, this is not the case with the rotation.
The values displayed on the graph editor’s side are the same regardless of the keyframed parameter.
With scale, we could increase the scale by 4 or decrease it by 0.5. These are small values that are easy to view in the editor.
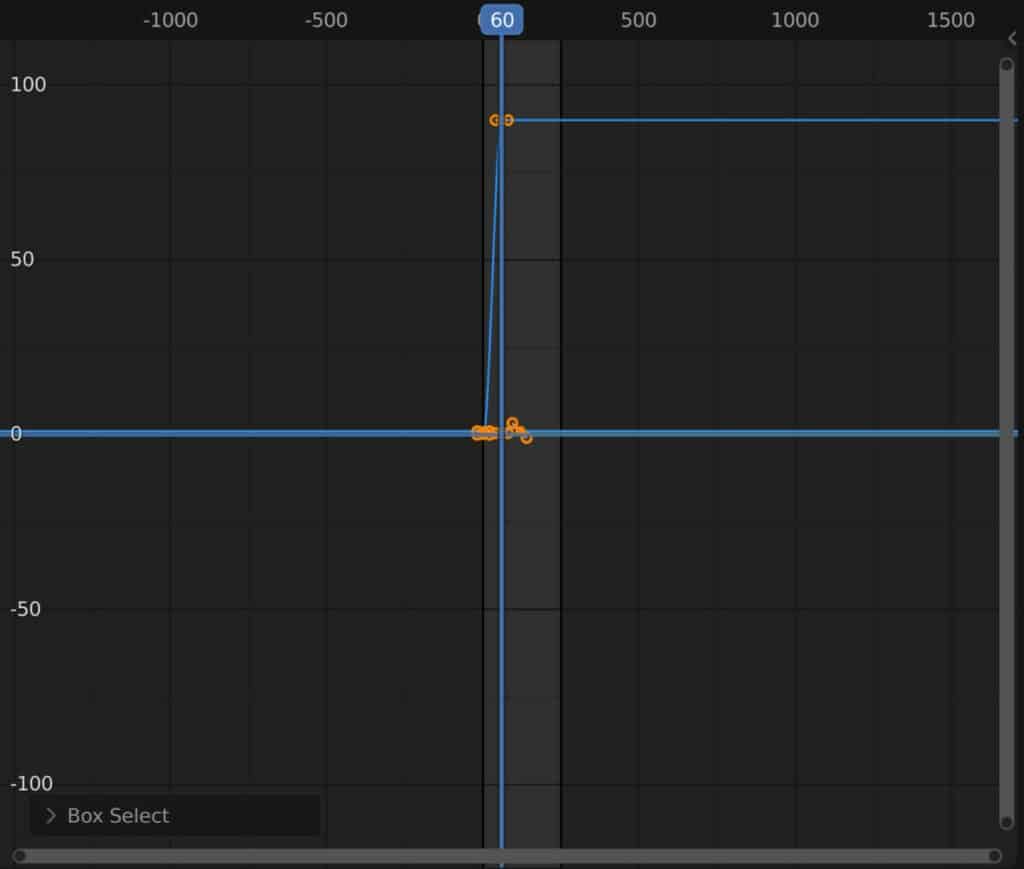
But with rotation, we work with degrees, which use much higher numbers, such as when we want to rotate 90 degrees on the Z axis.
The graph editor becomes a lot more challenging to read as we are required to zoom out to locate our keyframes.
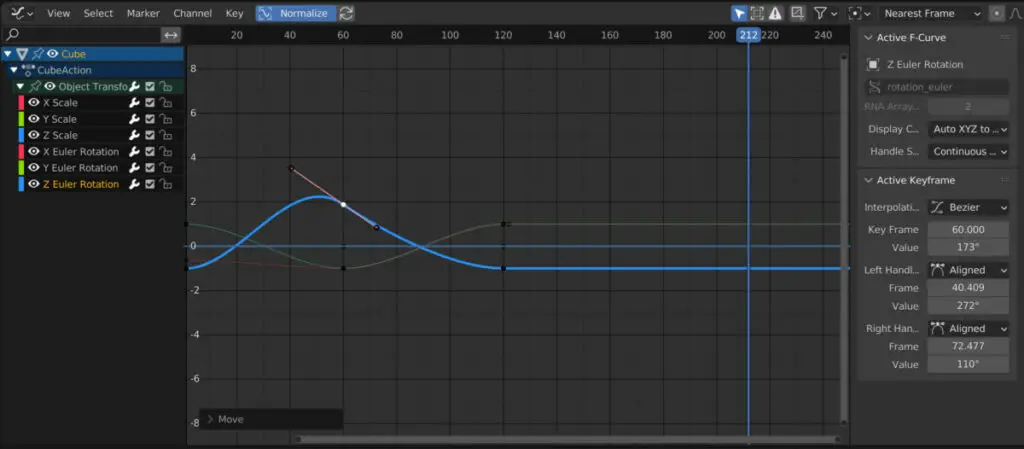
A quick solution is to normalize the F-Curve, which we have been using to display our keyframes.
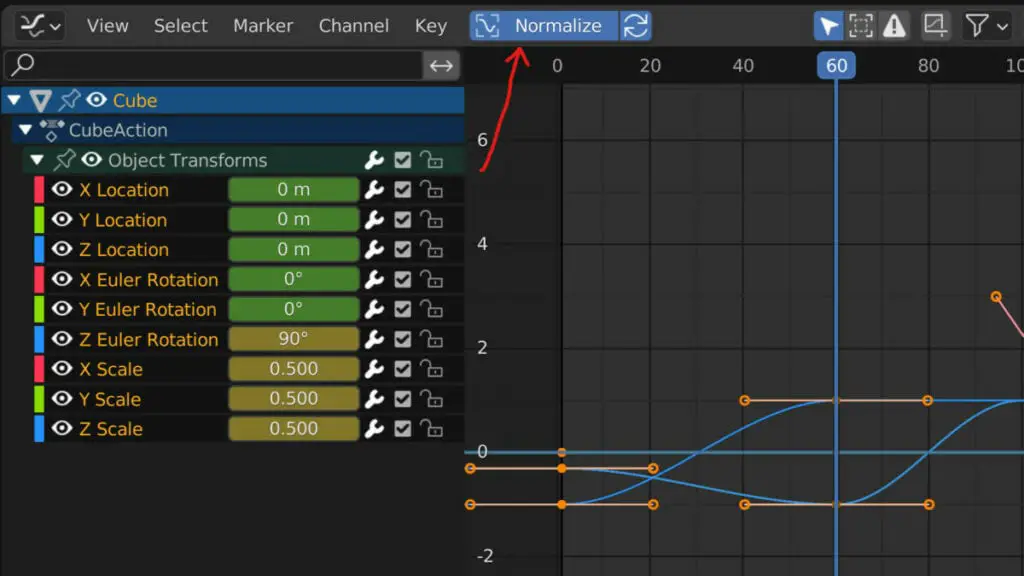
In the header bar of the graph editor, you will see the option to toggle the normalize feature. This will revert the points to a -1 to 1 range, making it much easier to view your keyframes.
A small button directly next to the normalize button is used to toggle automatic normalization. When turned on, the graph editor will snap back to the -1 to 1 range every time a change is made.
Thanks For Reading
We appreciate you taking the time to read through the article. We hope you found the information you were looking for. If you are interested in learning more about the Blender software, you can check out a few of the articles we have listed below.
- How To Use The Dope Sheet For Animation (Beginners Guide)
- How To Use The Timeline For Animation (Beginners Guide)
- The Process Of Creating Keyframes For Animations
- Defining The Animation Frame Range
- Converting An Image Sequence To A Movie File